Price action refers to the movement and behavior of a stock price on a chart over a period of time. In the context of trading, particularly in technical analysis, traders use price action to make informed decisions about buying or selling financial instruments such as stocks, currencies, commodities, or indices. Price action analysis does not rely on traditional indicators or oscillators; instead, it focuses on studying and interpreting the raw price movements and patterns on a chart.
This approach is rooted in the belief that historical price movements and patterns tend to repeat, and by understanding them, traders can make informed decisions about future market movements. Traders using price action are typically interested in chart patterns, candlestick formations, and support/resistance levels to make trading decisions.
Key components of price action analysis include:
1. Candlestick Patterns:
Candlestick charts display the open, high, low, and close prices for a specific period. Traders analyze individual candlesticks and patterns formed by multiple candles to gain insights into market sentiment. Common patterns include doji, engulfing, hammer, and shooting star patterns.
Each “candle” on the chart represents a time period (like a day, week, month). The candle has a body and wicks. The body shows the opening and closing prices, and the wicks show the highest and lowest prices during that time. Green candle mean the price went up during that time and Red candle mean the price went down.

Also Read: Most common Candlestick Pattern
2. Support and Resistance:
Support and resistance levels are horizontal lines drawn on a chart to identify key price levels where the market has historically shown a tendency to either stall or reverse. Traders use these levels to make decisions about entry and exit points.
Think of certain price levels as floors and ceilings. Prices often bounce off these levels. The floor (support) is where prices tend to stop going down, and the ceiling (resistance) is where prices often stop going up.
Identifying support and resistance helps you understand the overall direction a stock might be heading. Traders often make decisions at these levels. For example, they might buy when the price hits support or sell when it approaches to resistance. Also Once a support level is broken, it can become resistance, and vice versa.
3. Trends:
Trendlines are drawn on a chart to represent the direction of the market trend. They help traders identify the prevailing trend and potential reversal points. Generally we see three types of trend Uptrend, Downtrend and Sideways trend.
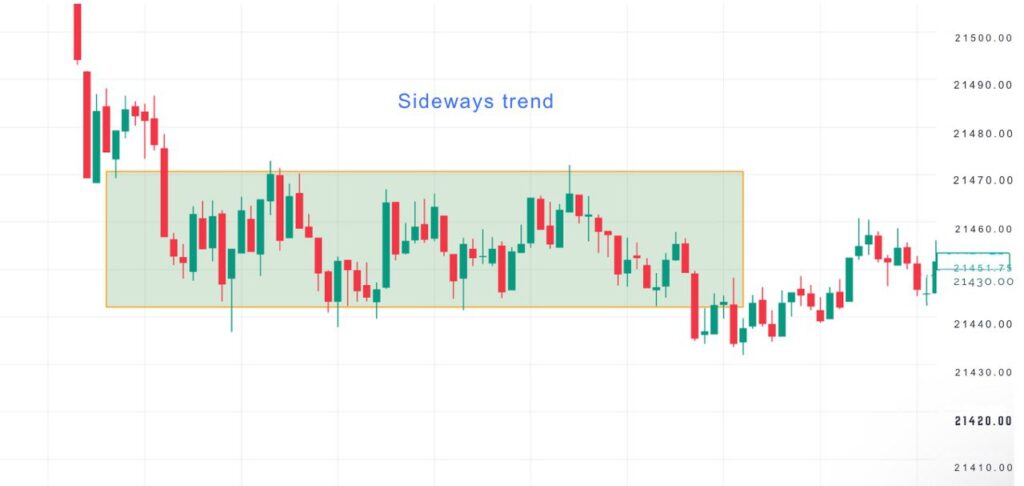
In an uptrend, the highs and lows generally get higher and In a downtrend, they get lower. Traders often draw lines connecting the highs or lows on a chart to visualize trends. These lines are called trendlines. These trends can be for short-term (days or weeks), medium-term (months), or long-term (years). The duration depends on the time frame you’re looking at.
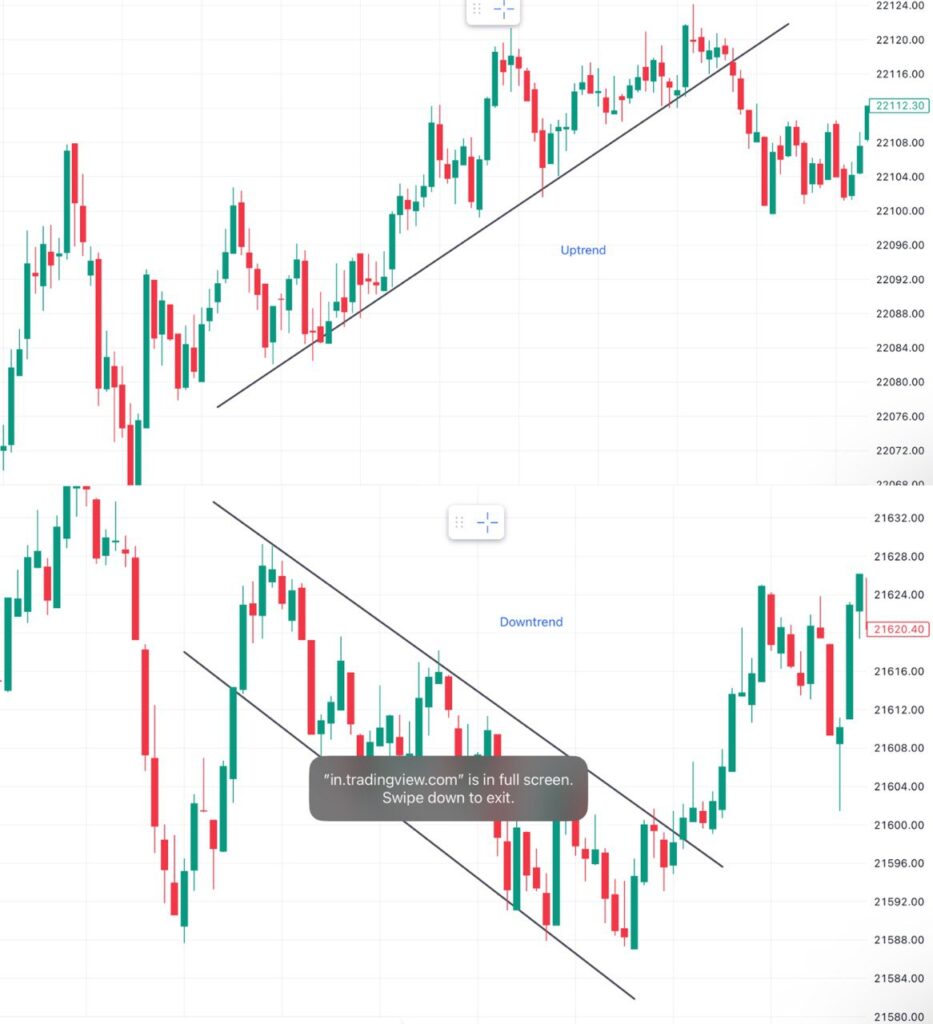
Sometimes, trends change direction. An uptrend might turn into a downtrend, and downtrend turn into a uptrend. This is called a trend reversal. Understanding the trend helps traders and investors make decisions. For example, in an uptrend, they might consider buying, and in a downtrend, they might consider selling.
Also Read: Top 10 Chart Pattern
4. Volume Analysis:
Volume refers to the number of shares traded in a particular stock or the market as a whole during a given period, like a day or a week. We think of volume as the “activity level” in the market. It tells you how many people are buying and selling stocks.
In an uptrend, increasing volume can be a positive sign, confirming the strength of the trend. In a downtrend, increasing volume might indicate strong selling pressure. Changes in volume can sometimes indicate a trend reversal. For instance, a decrease in volume during an uptrend might signal a potential reversal to a downtrend.
Volume is often used as a confirmation tool. If a price move is accompanied by high volume, it suggests that the move is more likely to be sustained or not. Traders may compare current volume to average volume levels to determine if the current activity is unusually high or low.
Summary:
Traders who employ price action analysis typically aim to identify high-probability trading opportunities based on historical price movements. By understanding the psychology of market participants reflected in the price action, traders can make more informed decisions and develop effective trading strategies. It’s important to note that successful price action trading requires experience, discipline, and a thorough understanding of market dynamics.