


Chart patterns are formations that traders and technical analysts use to identify potential price trends and reversals in financial markets. Traders and analysts use chart patterns to identify potential trends, reversals, or continuation of price movements in various financial instruments such as stocks, currencies, commodities, and indices. These patterns are formed by the regular and repeated behavior of market participants, reflecting their sentiments and decision-making processes.
Ten popular chart patterns:
- Head and Shoulders
- Symmetrical Triangle
- Ascending Triangle
- Descending Triangle
- Double Top
- Double Bottom
- Cup and Handle
- Flag and Pennant
- Wedge Patterns
- Triple Top and Triple Bottom
Understanding chart patterns involves analyzing the psychology of market participants and the balance between buyers and sellers. Traders often use these patterns in conjunction with other technical analysis tools, such as support and resistance levels, trendlines, and various technical indicators, to make informed trading decisions.
It’s essential to note that while chart patterns can provide valuable insights, they are not foolproof, and market conditions can change. Traders often use a combination of technical and fundamental analysis, along with risk management strategies, to make well-informed trading decisions.
1. Head and Shoulders
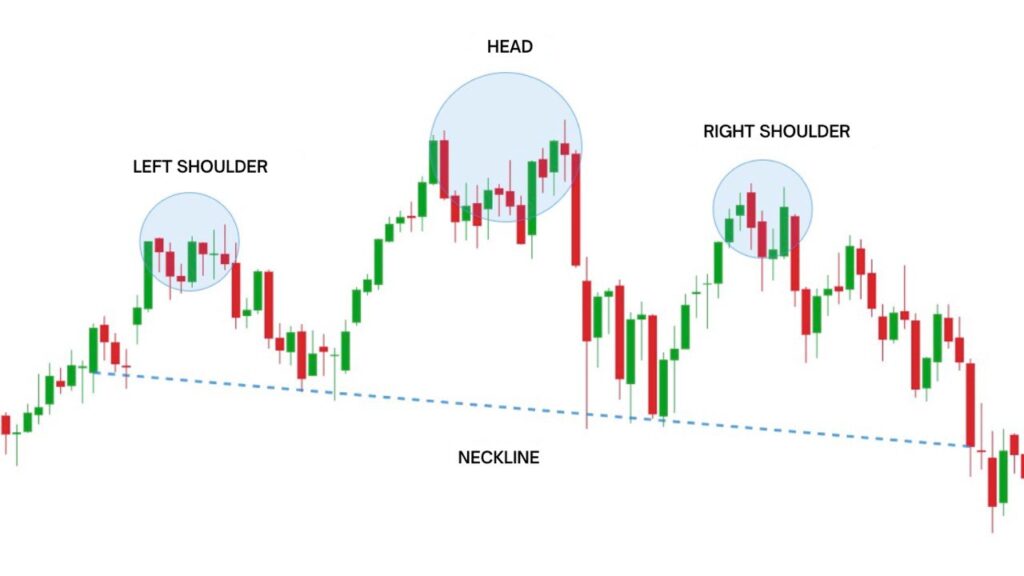
It is named for its visual Similarity like head and shoulders when plotted on a price chart. The pattern consists of three peaks – a higher peak (head) between two lower peaks (shoulders). The two shoulders are roughly at the same price level, forming a distinct and recognizable pattern.
The Head and Shoulders pattern is a classic reversal pattern in technical analysis, signaling a potential change in the direction of a prevailing trend. A horizontal line drawn across the lows of the left and right shoulders. It will act as a support level also known as ‘neckline’.

How we trade Head and Shoulder pattern?
- If you see a Head and Shoulders pattern in an uptrend, you might consider selling (going short) when the price breaks below the neckline.
- Your stop-loss would be placed above the right shoulder, and the potential target for the trade is based on the measured distance from the head to the neckline.
- Check if the breakout below the neckline is accompanied by higher trading volume. Increased volume can strengthen the validity of the pattern.
- Be aware that prices might sometimes retest the neckline after the initial breakdown. The neckline, which was support, may now act as resistance.
2. Symmetrical Triangle
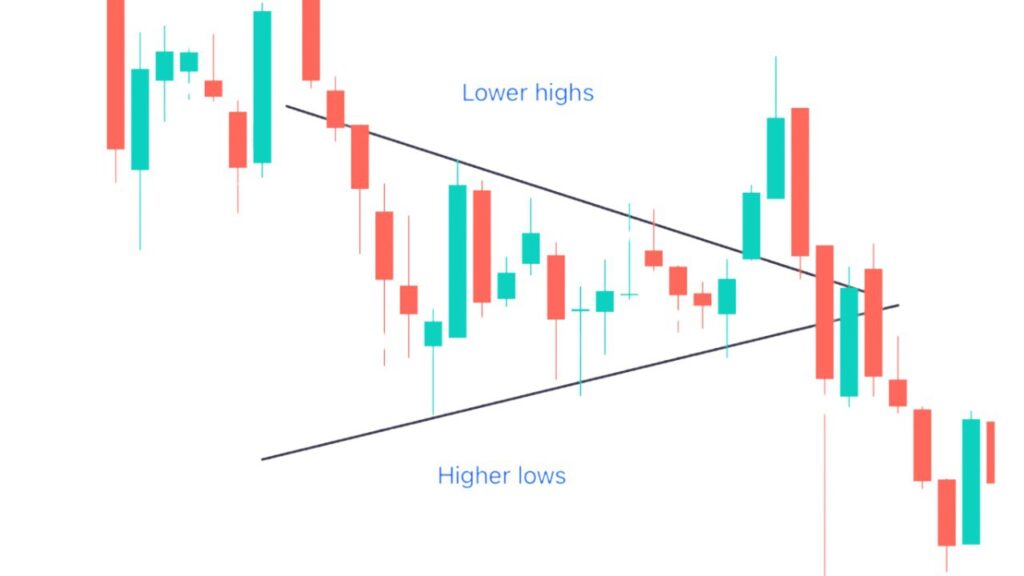
A symmetrical triangle is a chart pattern formed by two converging trendlines, one representing the highs (resistance) and the other representing the lows (support). Look for a triangle shape formed by two lines on the price chart. One line connects higher lows, and the other connects lower highs. The price oscillates between these converging trendlines, forming higher lows and lower highs.
When a triangle pattern forms, and there’s no obvious trend before that, the market could go up or down when it breaks out. This type of triangle is called symmetrical, and it’s like a two-way street. It works best in markets that are unpredictable and can swing either way.
How we trade Symmetrical Triangle?
- Look for a triangle shape formed by two lines on the price chart. One line connects higher lows, and the other connects lower highs.
- Prices bounce between the converging trendlines, creating a squeeze effect within the triangle.
- If Prices break above the upper trendline (bullish breakout) or If Prices break below the lower trendline (bearish breakout).
3. Ascending Triangle
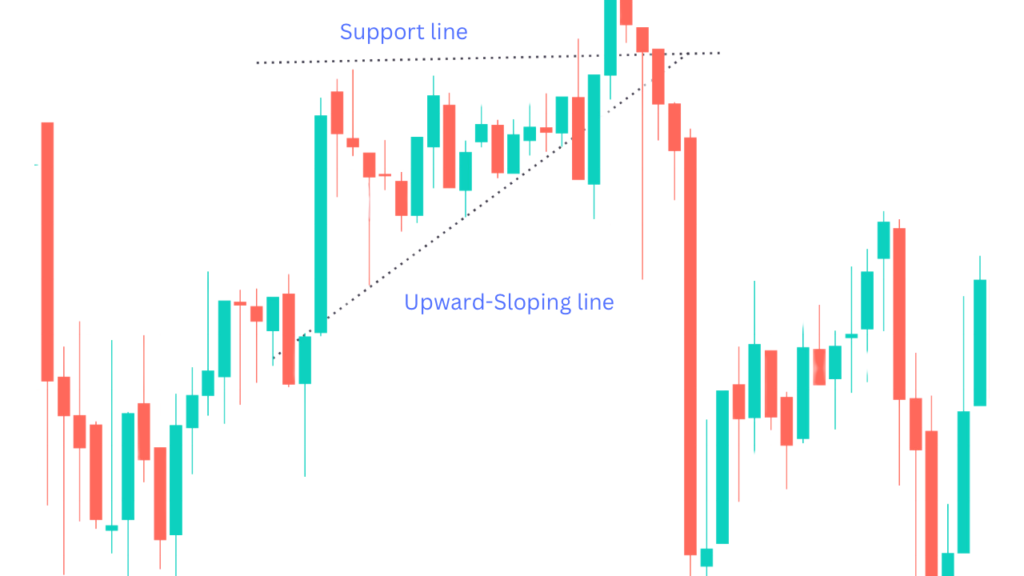
An ascending triangle is formed when there is a horizontal line (resistance) meeting with an ascending trendline (higher lows). It looks like a right-angled triangle, where the horizontal line acts as resistance, and the ascending trendline (upward-sloping line) acts as support, converging towards each other.
Traders often interpret this pattern as a sign that buying pressure is gradually increasing and breakout to the upside is likely to happen. Ascending triangle is generally considered a bullish patterns.
How we trade Ascending Triangle?
- Enter a long (buy) position when the price breaks above the resistance level with increased trading volume, signaling a strong upward momentum.
- Set a stop-loss just below the ascending trendline to limit potential losses if the breakout fails and the price moves downwards.
4. Descending Triangle
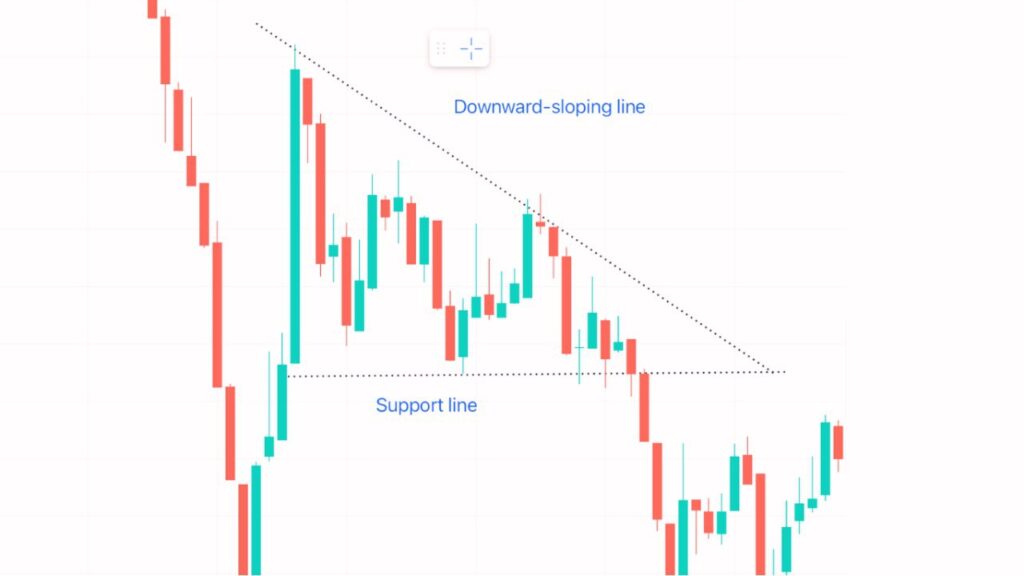
A descending triangle is generally considered a bearish chart pattern. It forms when the price consistently makes lower highs (downward-sloping trendline) while maintaining roughly the same lows (horizontal support line).
The descending triangle suggests that sellers are gradually gaining control. If the price breaks below the horizontal support line, it is often interpreted as a bearish signal, indicating a potential continuation of the downtrend.
How we trade Descending Triangle?
- Before enter into any position wait for the price to touch the support line at least twice, forming a horizontal base.
- Consider entering a short (sell) position when the price breaks below the support line. Some traders wait for a decisive close below the support for confirmation.
- Place a stop-loss just above the support line to manage risk in case of a false breakout. False breakouts can occur, so confirmation through volume and price action is crucial.
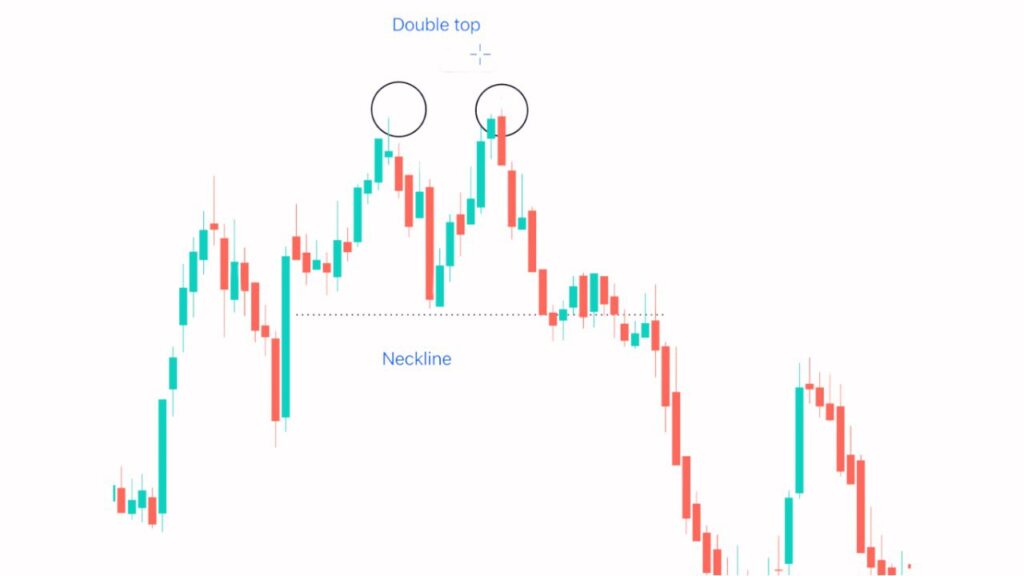
5. Double Top
The double top pattern is a bearish reversal pattern that typically forms after an uptrend and signals a potential change in trend direction. It is characterized by two peaks at approximately the same price level, separated by a trough (valley) in between.
The price reaches a high point, forming the first peak. After the first peak, the price retraces to a certain level, forming a trough or valley. The price attempts to rally again but fails to surpass the level of the first peak, forming the second peak. A horizontal line drawn connecting two low of trough or valley points (neckline).
How we trade Double Top?
- Look for an uptrend in the price. Identify the Double top pattern and drawn the neckline.
- Wait for the price to break below the neckline (the line connecting the troughs). This break is a crucial confirmation of the pattern.
- Set a stop-loss order above the second peak or the recent high. This helps manage risk in case the pattern doesn’t play out as expected.
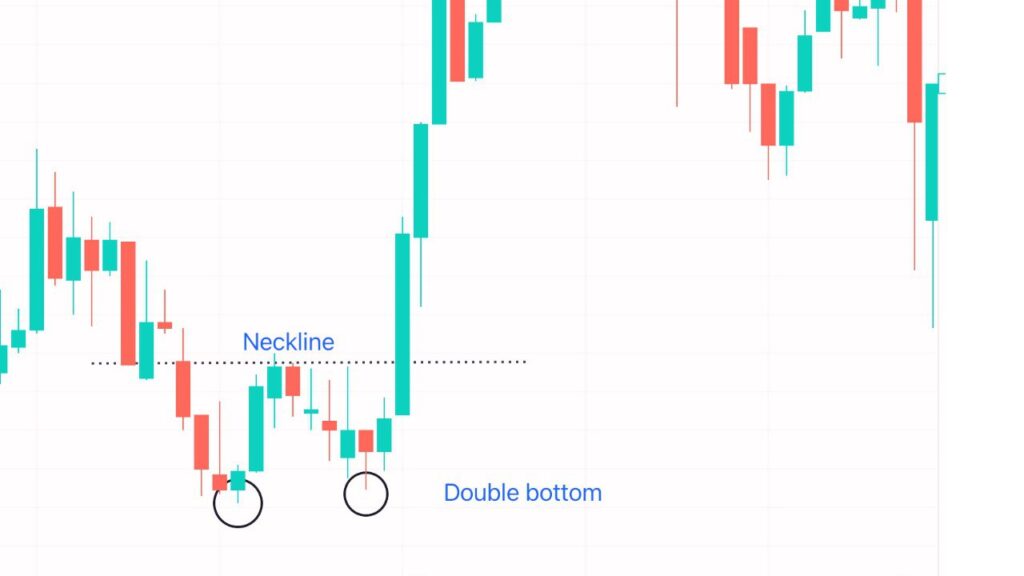
6. Double bottom
The double bottom pattern is a bullish reversal pattern that forms after a downtrend. The first low point in the downtrend is shown by the first bottom. After that, prices go up a bit but then fall again to make the second bottom. Usually, this second bottom isn’t lower than the first one, creating a support level. The pattern is finished when prices go higher than the highest point between the two bottoms, which suggests that the trend might be changing.
How we trade Double Bottom?
- Traders often enter a long (buy) position when prices break above the high point between the two bottoms. This breakout serves as confirmation of the pattern.
- Some traders may wait for a pullback to the breakout level before entering to ensure the validity of the reversal.
- A common approach is to place a stop-loss order below the lowest point of the second bottom.
7. Cup and Handle
The Cup and Handle pattern is a bullish continuation pattern it usually develops after a significant uptrend in a stock’s price that resembles the shape of a tea cup on a price chart. It consists of two main parts: the cup and the handle.
Prices initially decline, then gradually round and form a round shape structure. The lowest point of the cup is the “bottom” of the pattern. This rounded bottom indicates a period of consolidation or a temporary reversal in the previous uptrend. After the cup formation, there is a short pullback or retracement, forming the handle.
How we trade Cup and Handle?
- First wait for the cup and handle pattern to fully form before considering a trade.
- Consider entering a long (buy) position near the end of the handle, just before the expected breakout. Some traders wait for the price to break above the resistance level formed by the top of the cup.
- Place a stop-loss order below the lowest point of the cup to manage risk.
8. Flag and Pennant
Flags and pennants often indicate a continuation of the existing trend. These patterns are formed when there is a brief consolidation or pause in the price movement before the trend resumes.
A flag pattern is a rectangular-shaped consolidation that slopes against the prevailing trend. It consists of two parallel trendlines – one representing the support level and the other representing the resistance level. Flag patterns can be bullish or bearish. A pennant is a small symmetrical triangle that forms after a strong price movement. It represents a brief consolidation before the trend resumes.
How we trade Flag and Pennant?
- For entry look for a breakout in the direction of the preceding trend. Set profit targets based on the length of the flagpole and pennant pole.
- Place stoploss below the low (for a bullish pennant and flag) or above the high (for a bearish pennant and flag) of the pattern.
9. Wedges Patterns
A wedge pattern is a technical analysis formation that is characterized by converging trendlines on a price chart. It is formed by drawing two trendlines—one connecting the highs and the other connecting the lows. These trendlines converge, creating a wedge-like shape. Wedge patterns can be either rising (ascending) or falling (descending).
Rising Wedge: Forms when the upper trendline slopes upwards, and the lower trendline slopes upwards at a steeper angle. Usually considered a bearish pattern, suggesting a potential trend reversal to the downside.
Falling Wedge: Forms when the upper trendline slopes downwards, and the lower trendline slopes downwards at a steeper angle. Typically seen as a bullish pattern, indicating a potential trend reversal to the upside.
How we trade Wedges?
- Rising Wedge: Consider short positions (selling) when the price breaks below the lower trendline.
- Falling Wedge: Consider long positions (buying) when the price breaks above the upper trendline.
- Look for confirmation of the breakout with an increase in trading volume. A breakout with higher volume often strengthens the validity of the pattern.
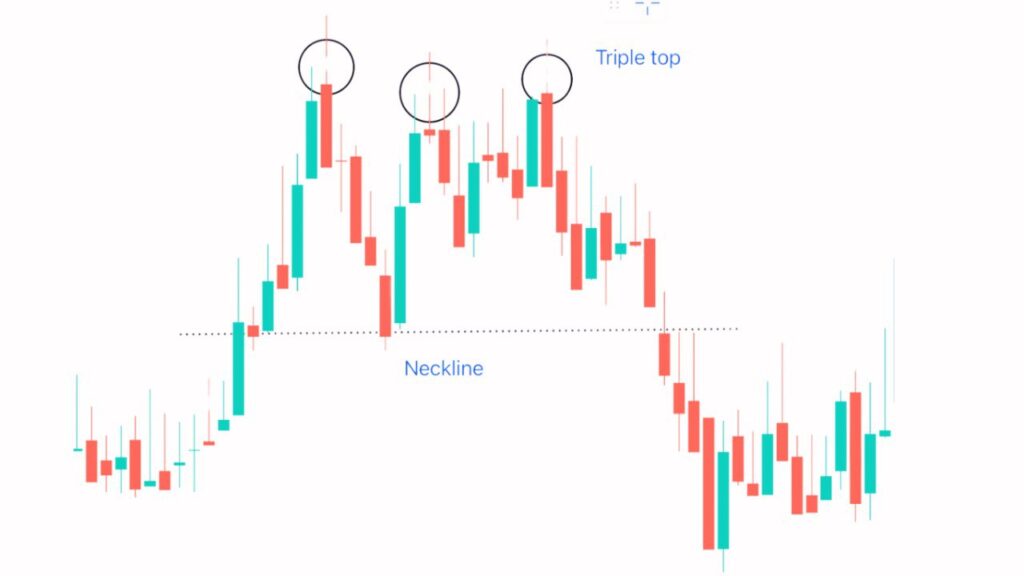
10. Triple Top and Triple Bottom
Three consecutive peaks ( highs) at approximately the same price level makes triple top. The peaks represent failed attempts to break above a particular resistance level. Traders may interpret it as a reversal pattern, suggesting a possible shift from bullish to bearish sentiment.
Three consecutive troughs (lows) at approximately the same price level makes triple bottom. The lows represent unsuccessful attempts to break below a specific support level. Traders may view it as a reversal pattern, indicating a possible shift from bearish to bullish sentiment.
How we trade Triple Top and Triple Bottom?
- Triple Top: Consider entering a short (sell) position when the price breaks below the support level formed by the lows between the peaks. Place a stop-loss order above the highest peak to manage risk.
- Triple bottom: Consider entering a long (buy) position when the price breaks above the resistance level formed by the highs between the lows. Place a stop-loss order below the lowest trough (lows) to manage risk.