Candlestick patterns are important tools used in technical analysis to help understand and predict how prices will move in financial markets (like stocks, commodities, or forex). These patterns are made up of individual candlesticks shown on a price chart, and each candlestick shows the price movement for a certain time period, such as a day, an hour, or a minute.
Here, we will look at some of the most common and effective candlestick patterns that help you understand market movements and identify trading opportunities. These patterns can signal potential reversals, continuations, or changes in market trends, making them valuable tools for making informed trading decisions.
How Individual Candlesticks formed?
A single candlestick is formed using four key data points that represent price movements within a specific time period( such as a minute).
- Open Price: The price at which the asset begins trading at the start of the time period.
- Close Price: The price at which the asset finishes trading at the end of the time period.
- High Price: The highest price the asset reaches during the time period.
- Low Price: The lowest price the asset reaches during the time period.
Structure of a Candlestick:

- Body: The rectangular part that shows the difference between the opening and closing prices. If the close price is higher than the open price, the body is typically green or white (bullish candle). If the close price is lower than the open price, the body is typically red or black (bearish candle)
- Wicks (or Shadows): The lines extending from the body. The upper wick represents the difference between the highest price and the body. The lower wick represents the difference between the lowest price and the body.
Bullish Candlesticks Patterns
Hammer Candlestick
The Hammer is a bullish reversal candlestick pattern that typically appears at the bottom of a downtrend. It indicates that buyers are starting to gain control after a period of selling.
Hammer has a small body at the upper end of the trading range and a long lower wick (shadow). There is little to no upper wick. The body can be green (bullish) or red (bearish), but a green body is more favourable as it shows buying strength.
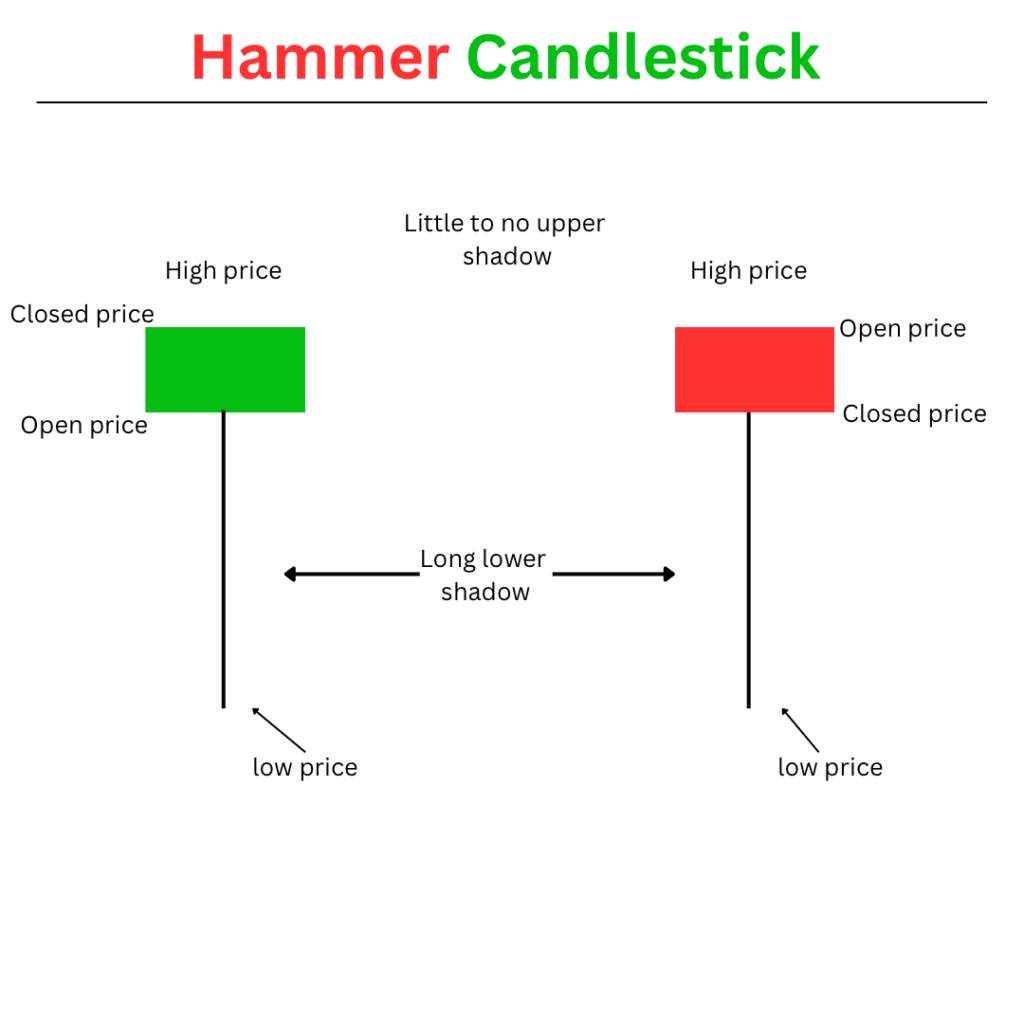
The long lower wick shows that while sellers drove the price down, buyers were able to push it back up, indicating potential strength and a reversal in sentiment. Traders often look for confirmation in the next candlestick (ideally a bullish candle) to validate the reversal.
Bullish Engulfing Candlestick
The Bullish Engulfing pattern is a two-candlestick reversal pattern that signals a potential shift from a bearish to a bullish trend. Bullish Engulfing pattern is a strong indicator of potential upward price movement.
The first candle is bearish (red) candle, indicates continued selling pressure. The next candle opens below the close of the first candle and closes above the open of the first candle, the body of the first candle.

The engulfing candle suggests a strong shift in sentiment. Buyers have stepped in with more strength than sellers, indicating that a reversal. This pattern is more reliable when it occurs after a downtrend and is often confirmed with subsequent bullish candles.
Morning Star Candlestick
Morning Star is a powerful bullish reversal pattern. It consists of three candlesticks and signals a potential shift in market sentiment from bearish to bullish.
This pattern begins with a strong bearish (red) candle, indicating that sellers are in control. The second candle is small, showing that the market is hesitating. This candle can have a small body and can either go up (bullish) or down (bearish). The final candle is a strong bullish candle that confirms the reversal, closing higher and ideally above the first candle’s body.
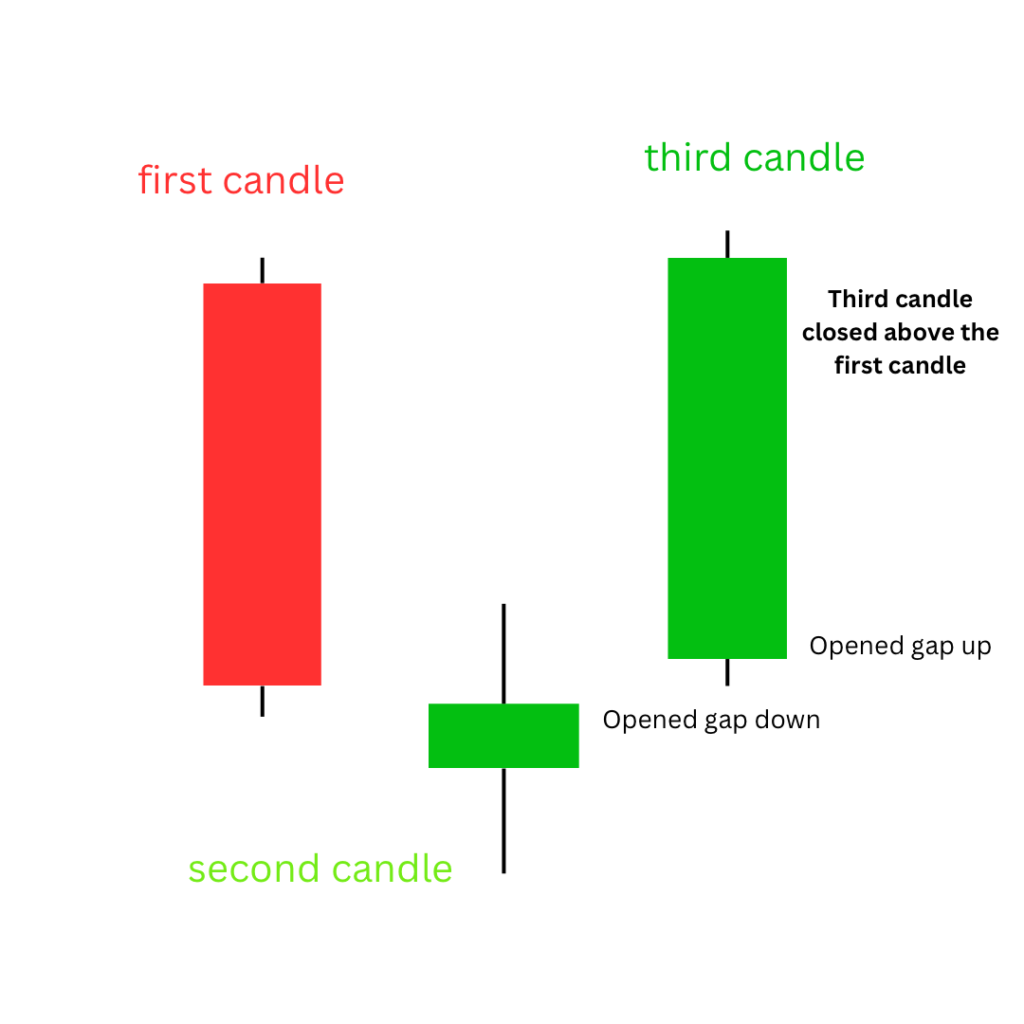
It indicates that in first candle sellers are dominant, while the second candle indicates indecision. The third candle confirms that buyers have taken control, signaling a potential upward trend.
Bearish Candlesticks Patterns
Shooting Star Candlestick
Shooting Star is a bearish reversal candlestick pattern that typically signals a potential change in market direction from bullish to bearish. Shooting star is the same shape as the inverted hammer.
Shooting Star has a small body located at the lower end of the trading range. It has a long upper wick (or shadow) that is at least twice the length of the body. There should be little to no lower wick. The color of the body can be red (bearish) or green (bullish). However, a red body is typically seen as more bearish.
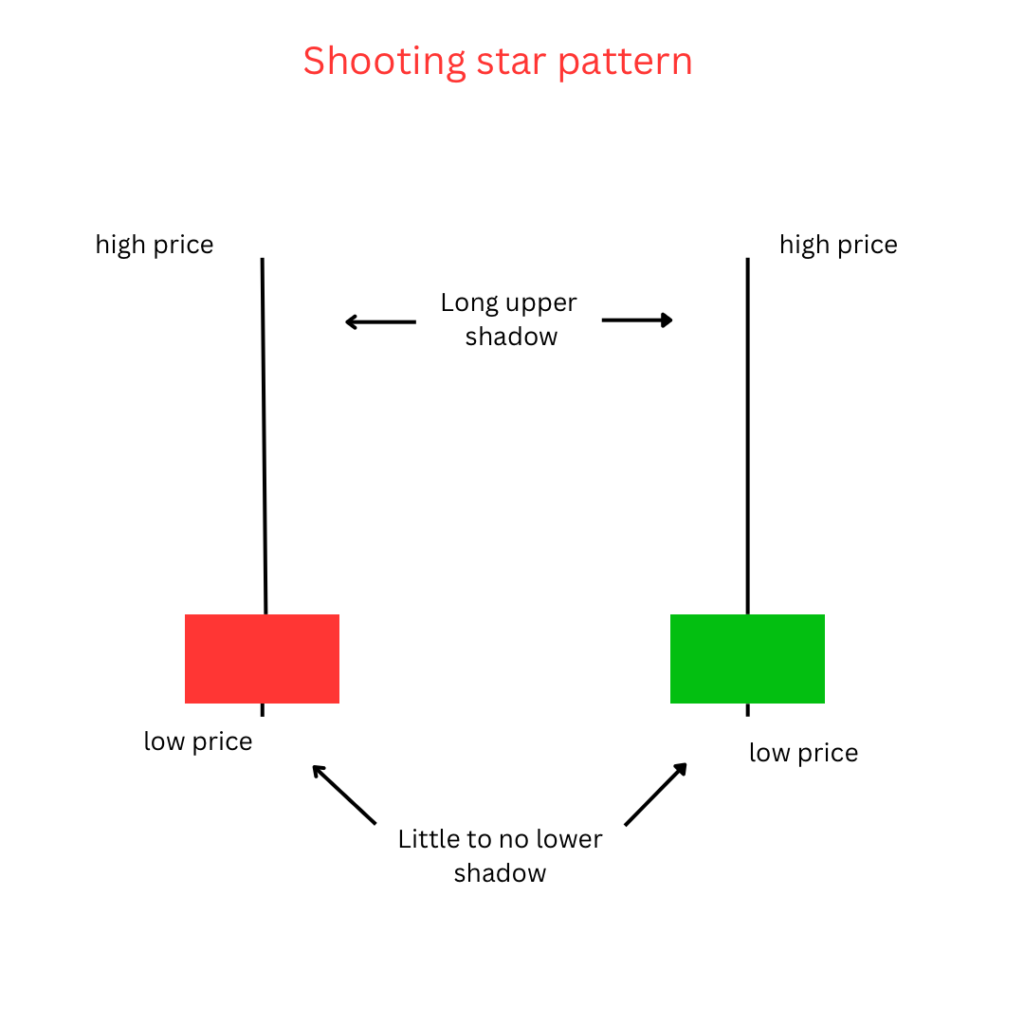
Shooting Star is more significant when it is confirmed by the next candlestick. Ideally, a bearish candle following the Shooting Star reinforces the reversal signal. By recognizing this pattern, traders can make informed decisions about selling or shorting an asset.
Bearish Engulfing Candlestick Pattern
A bearish engulfing candlestick is a pattern that can signal a potential reversal from an uptrend to a downtrend. It consists of two candles.
The first candle is bullish (green), that shows some buying activity. The second candle opens above the high of the first candle and closes below its low, creating a larger body that engulfs the first candle entirely.
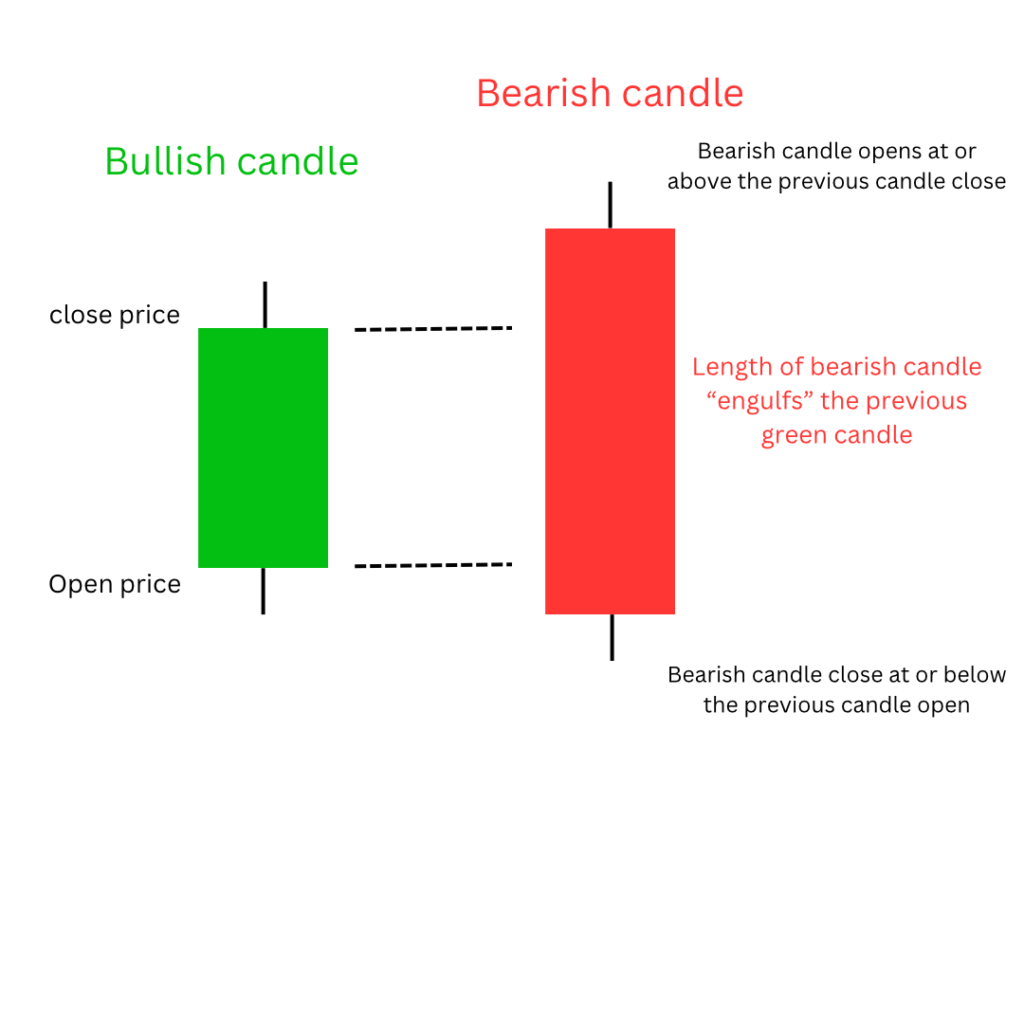
It typically appears after a series of upward price movements and indicates that sellers may be taking control of the market. Recognizing this pattern can help traders make informed decisions about entering short positions or exiting long positions.
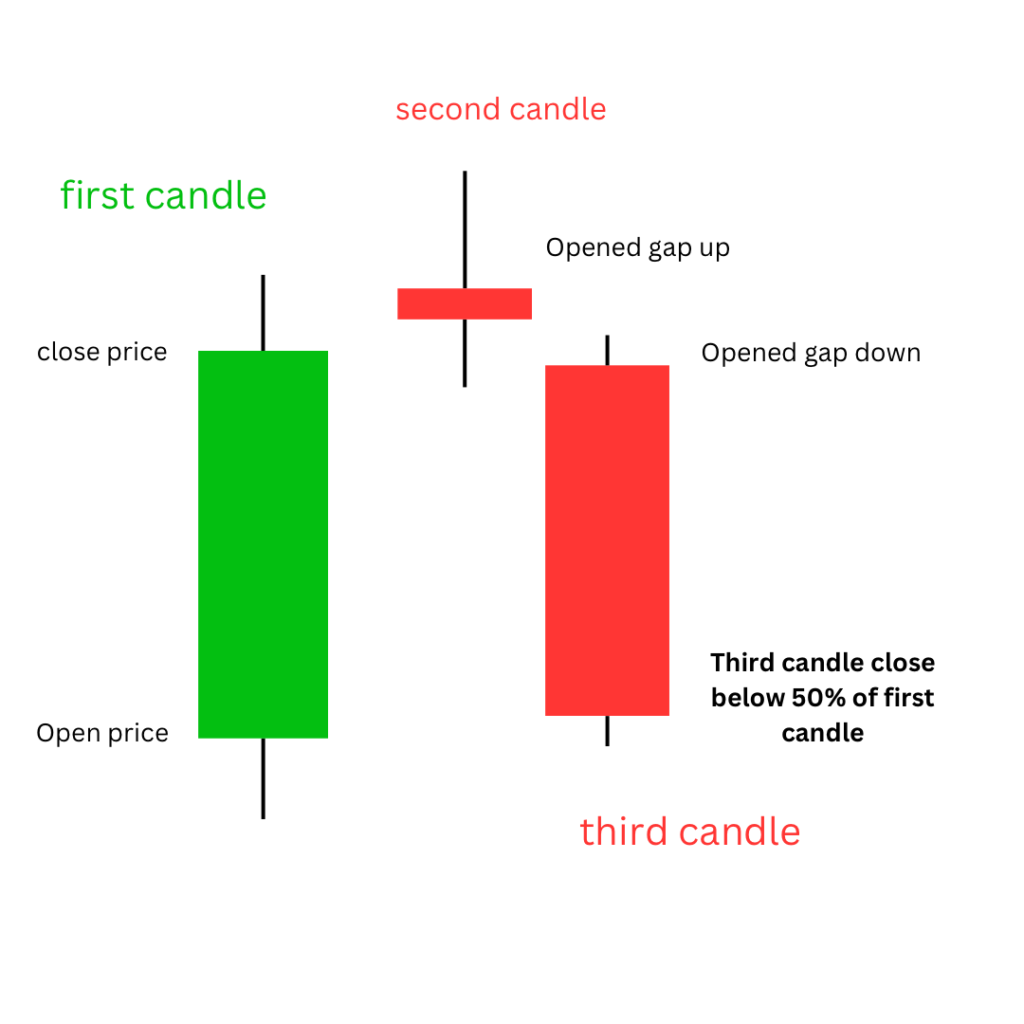
Evening Star Candlestick Pattern
The Evening Star is a bearish reversal candlestick pattern that appears at the top of an uptrend. It is equivalent of the bullish morning star.
The first candle is a long bullish candle. The second candle opens higher but shows little price movement, forming a small body indicates there is indecision between buyers and sellers. The third candle opens lower and closes significantly below the middle of the first candle.
Candlestick patterns are great tools for understanding market trends, and there are many more patterns to explore beyond what we’ve covered. They are easy to learn and can help you spot when the market might change direction. However, it’s very important to always manage your risk when trading, because even though candlestick patterns can be helpful, they don’t guarantee success. Use them as a guide, but make sure to have a solid plan to protect yourself from losses.